This case study features Social Pinpoint’s legacy platform SPP Classic.
The Initiative
After hearing from residents about speeding and road safety concerns, the Norwood Payneham & St Peters Council invited the community to share its ideas on how to improve the safety and liveability of the local street network in Glynde, Payneham, Payneham South, Firle, Trinity Gardens, and St Morris.
The Council started with traffic data collection to investigate road safety issues and then initiated a consultation study so that everyone in the community could have their say.
The Goal
The Council was eager to have a transparent conversation with the community about its road safety concerns and wanted to capture input from as many people as possible.
The team set out to maximize awareness of the study and make engagement opportunities highly accessible so that they could set up a strategic and prioritized road safety program.
The Approach
The Council created a dedicated consultation page to inform people who lived or worked in the area of the opportunity to provide input to Council staff and traffic consultants in writing or over the phone, at a community drop-in session, or via an online interactive-map-based survey.
The Social Pinpoint map was promoted online and within the study area, enabling the community to provide location-based feedback relating to traffic, cycling, walking, and public transport.
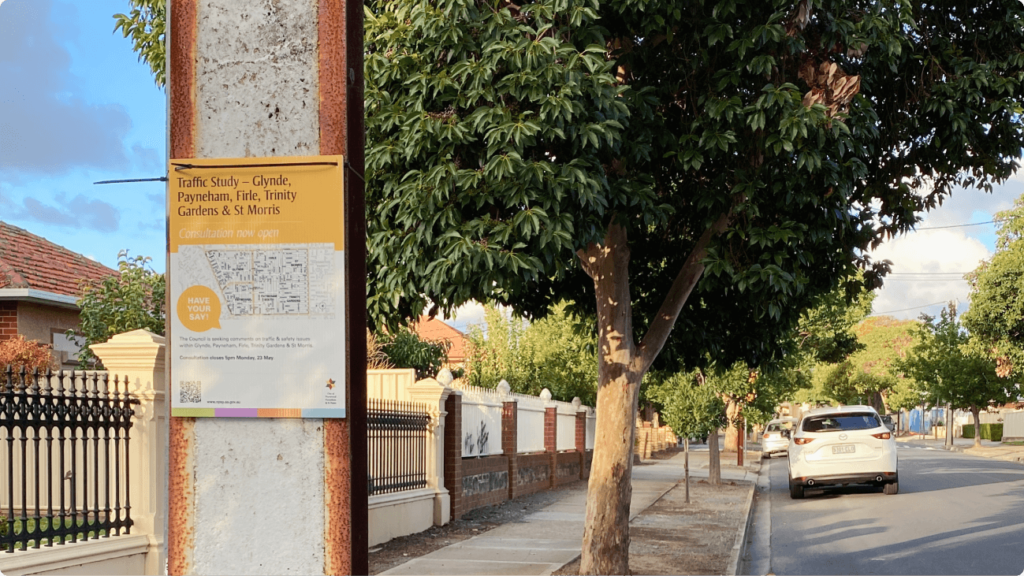
Given that the Council was targeting a broad area, the team completed over 5,000 letterbox drops, set up bright yellow signage in outdoor locations, and hung posters in community gathering places such as the library and town hall.
A personalized email was also sent to anyone who had previously shared feedback about road safety concerns with Council. The traffic study was also promoted on the Council’s Facebook page which has over 2,800 followers.
A QR code was placed on all promotional materials to direct people to the online consultation, while iPads and computers were provided at the in-person event so that attendees could share their feedback directly on the interactive map.
The complementary mix of face-to-face and online engagement methods ensured that all different types of community groups could provide feedback via their preferred method. It also increased the chance that people who lived in or traveled through the area would be reached.

The Result
The Council received over 1,000 engagements via its online platform and received a wealth of information to consider for its strategy.
The online interactive map also provided a new layer of visibility and transparency. Participants could explore other people’s feedback and vote on comments that they agreed with. As a result, the time spent on the platform was higher than in previous projects.
Respondents also needed to categorize the feedback that they added to the map and traffic was identified as the top concern (81%), as opposed to walking, cycling, and public transport. The map also revealed locations with the most feedback and made priority areas clear.
“We used Social Pinpoint for the first time to engage with a local study area encompassing around 5,000 residents. With a result of over 1,000 engagements on the platform, we couldn’t ask for a better response. On average we receive around an 8% response rate when we engage with our Community, so using a user-friendly platform like Social Pinpoint has given us true, real-time feedback. Using this digital platform was not only beneficial for our Community but also a better use of our time because we can extract the true data and easily prioritize our Community’s feedback.”
– Norwood Payneham & St Peters Council


